NexGen Solutions
Website Dashboard AI
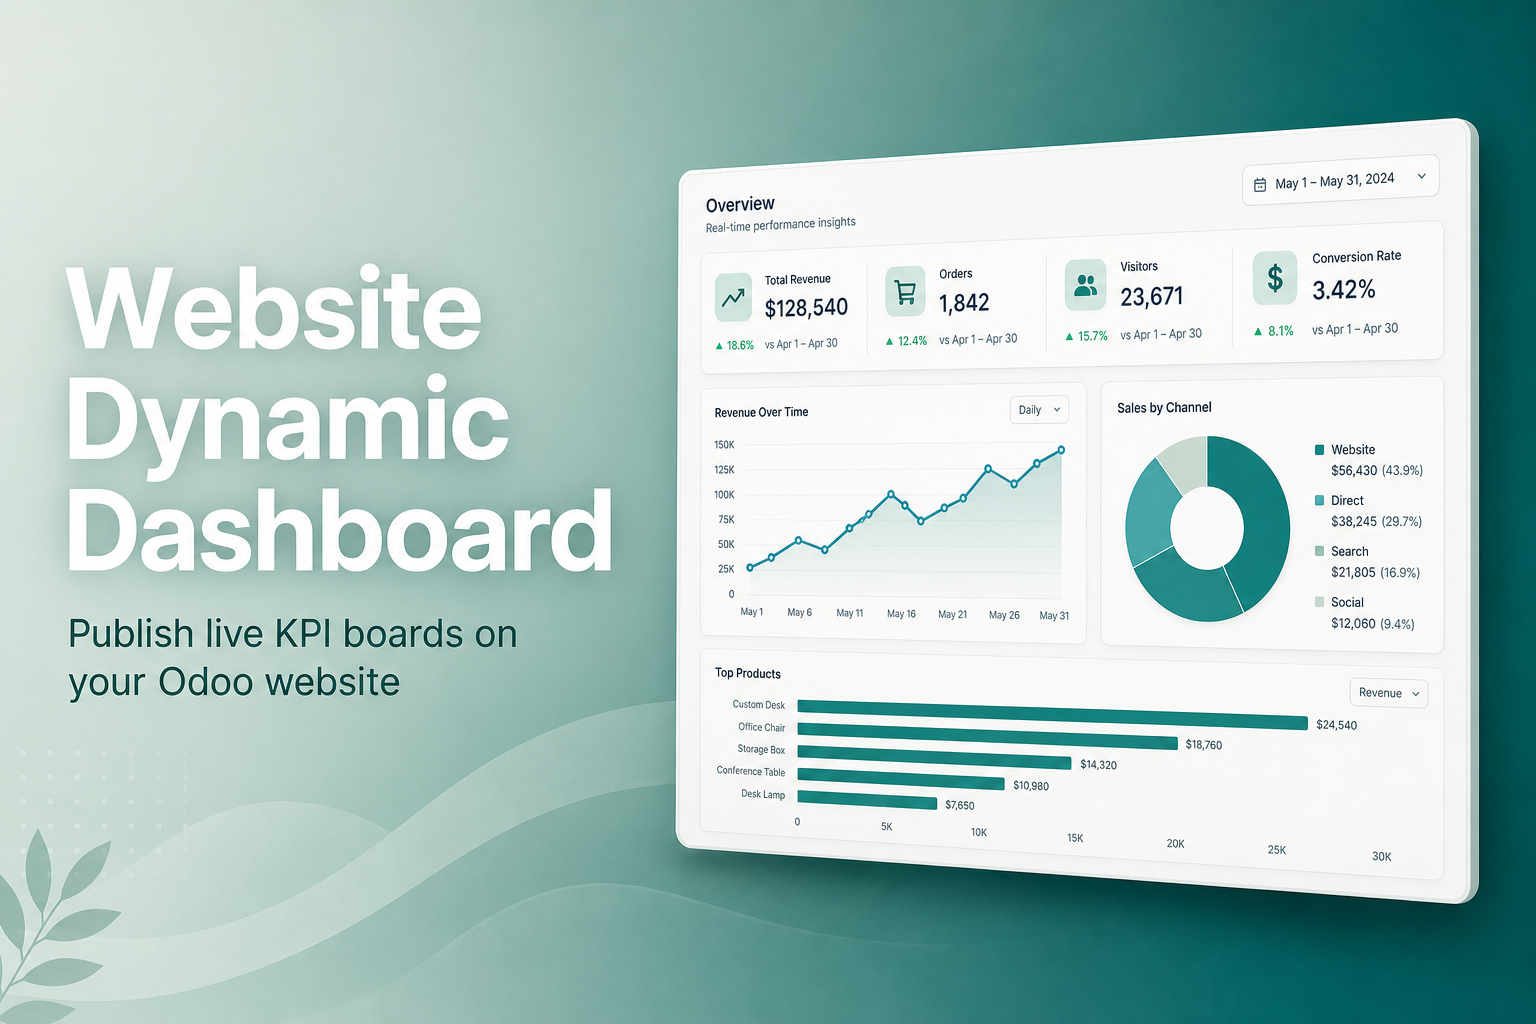
Publish your dashboard boards to the Odoo website — for public visitors, portal users, and internal teams. Same interactive charts, filters, themes, TV Mode, and Chart Options, beautifully adapted for the frontend by NexGen Solutions.
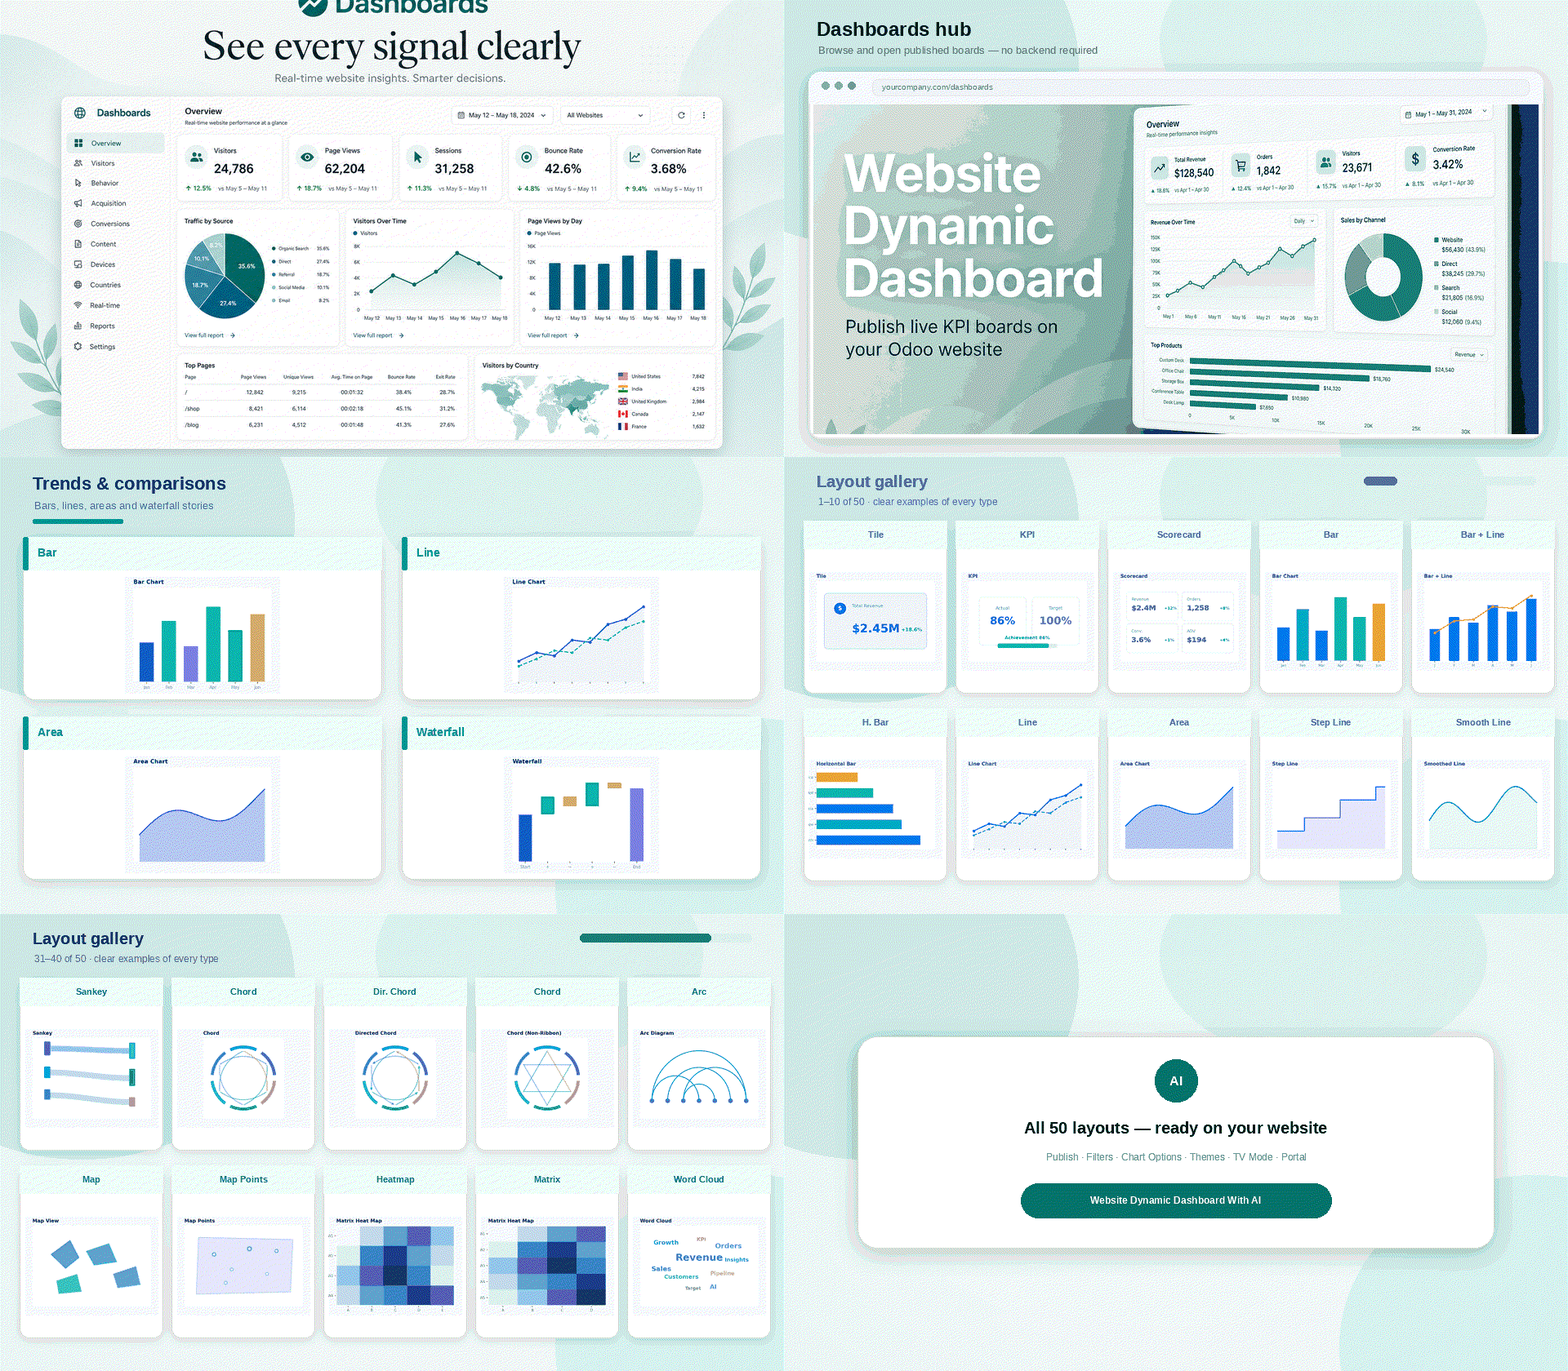
Main screen cover (GIF) — first frame is main_screenshot.png; this is the image used on the Odoo Apps listing card.
Why publish dashboards on the website?
Give customers, executives, and partners a branded live analytics experience — without opening the backend. Control who sees what, and keep every board interactive.
One-click publish
Toggle Show in Website and go live instantly
Public & portal
Open boards to visitors or authenticated portal users
Full interactivity
Filters, dates, Chart Options, drill-down, themes
Access control
Dashboard & item visibility by Odoo groups
Share & present
Secure links, exports, TV Mode, Present Mode
dynamic_dashboard_ai_nexgen).
Install Dynamic Dashboard AI first, then install this website extension.
Also requires the standard Website and Portal apps.
Website features in detail
Everything you need to publish, secure, and present live analytics on your Odoo website.
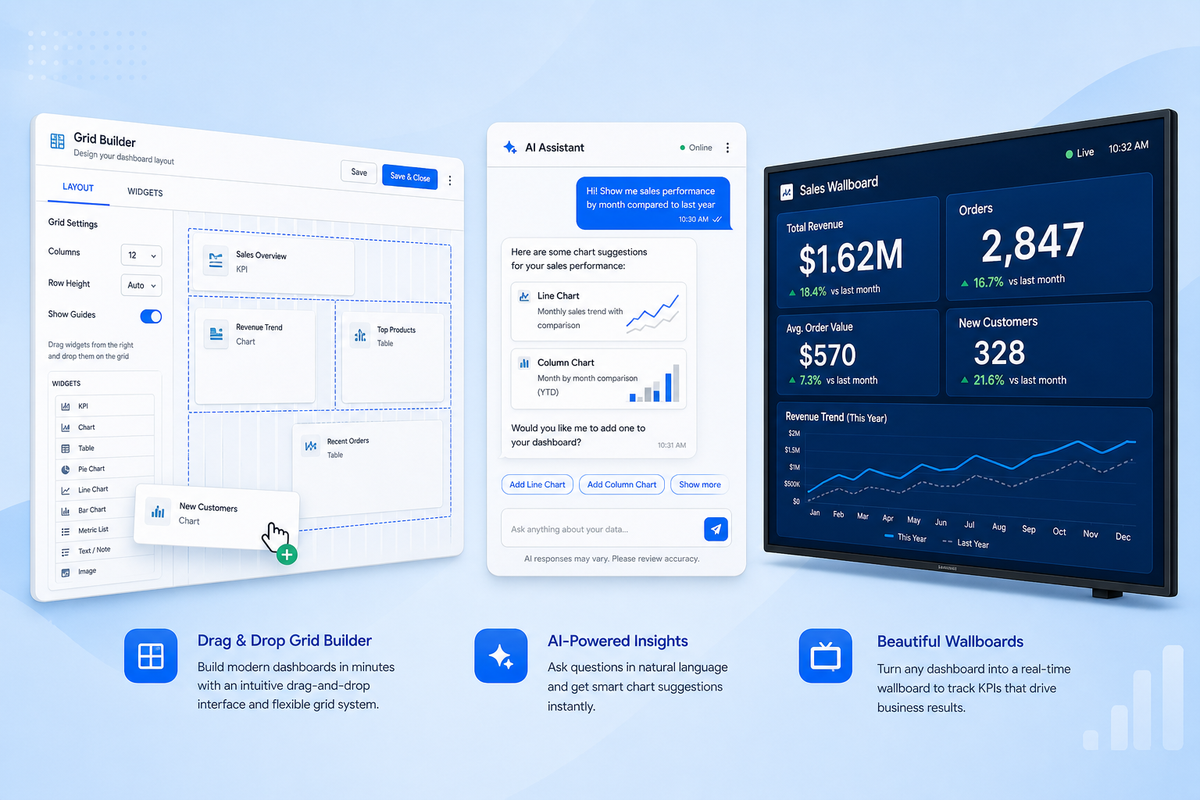
Publish any board to the website
Turn backend dashboards into public website pages with a clear Website Configuration tab.
- Boolean Show in Website on each dashboard
- Per-item Show in Website to hide individual widgets
- Website redirect button from the dashboard form
- Optional Add to Website Menu for main navigation
- Clean URL pattern:
/dashboard/
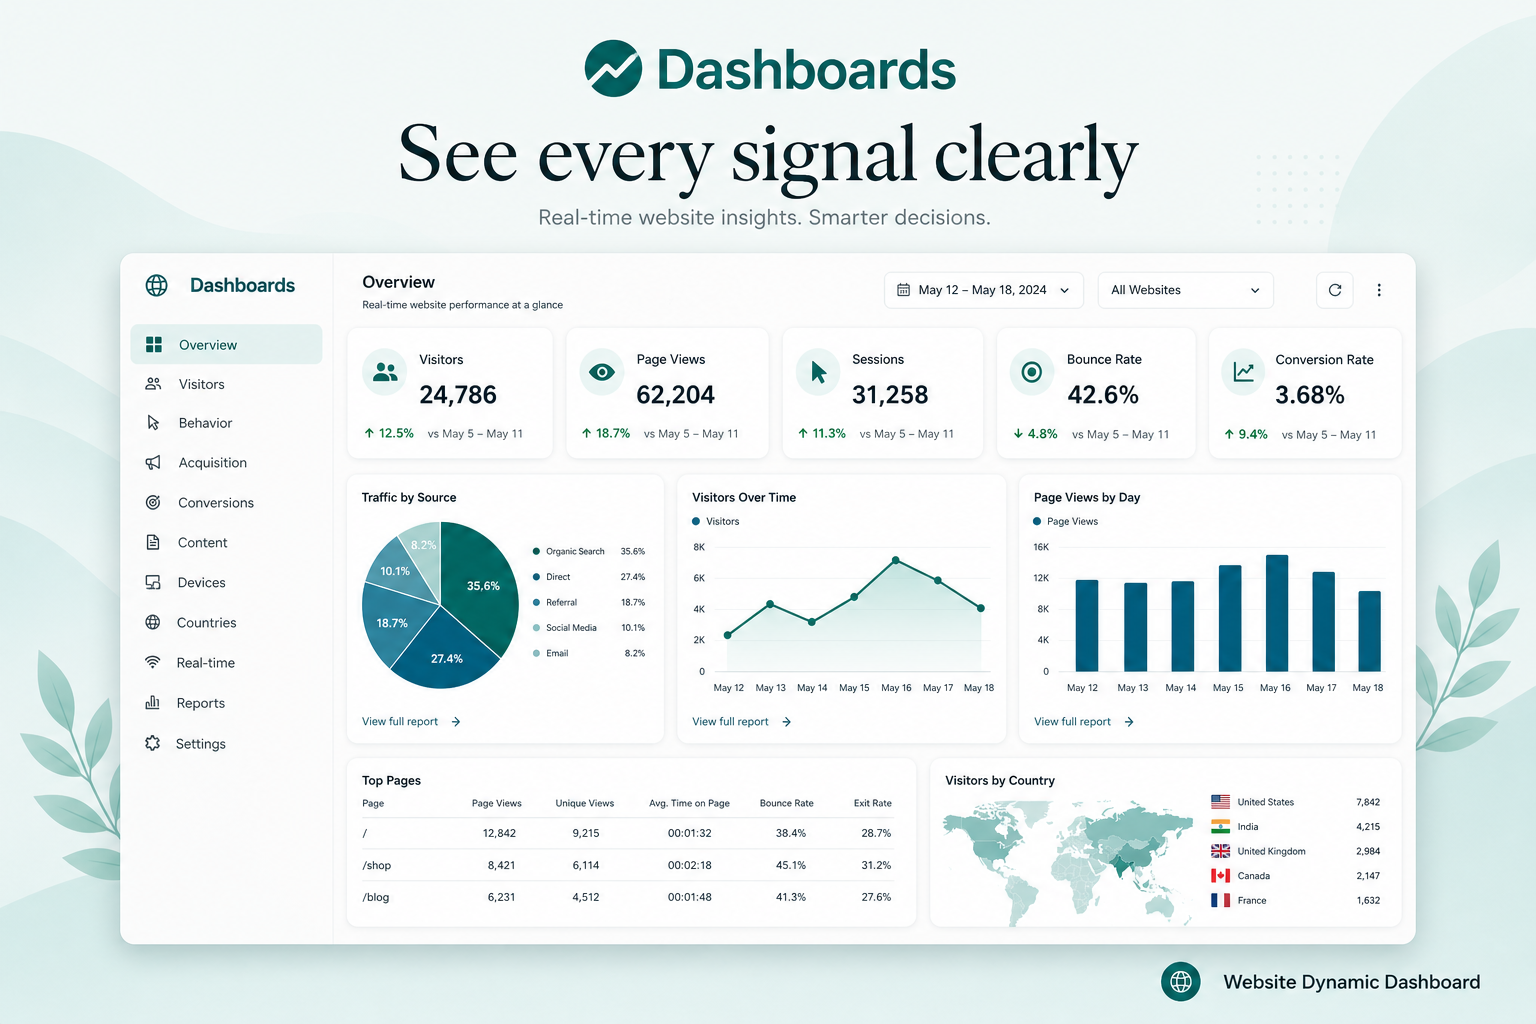
Beautiful /dashboards hub gallery
A branded landing page lists every published board with atmosphere, categories, and widget counts.
- Hero section with brand-first website design
- Card gallery of published dashboards
- Category / menu labels and item counts
- Pagination for large libraries
- Direct open of featured boards
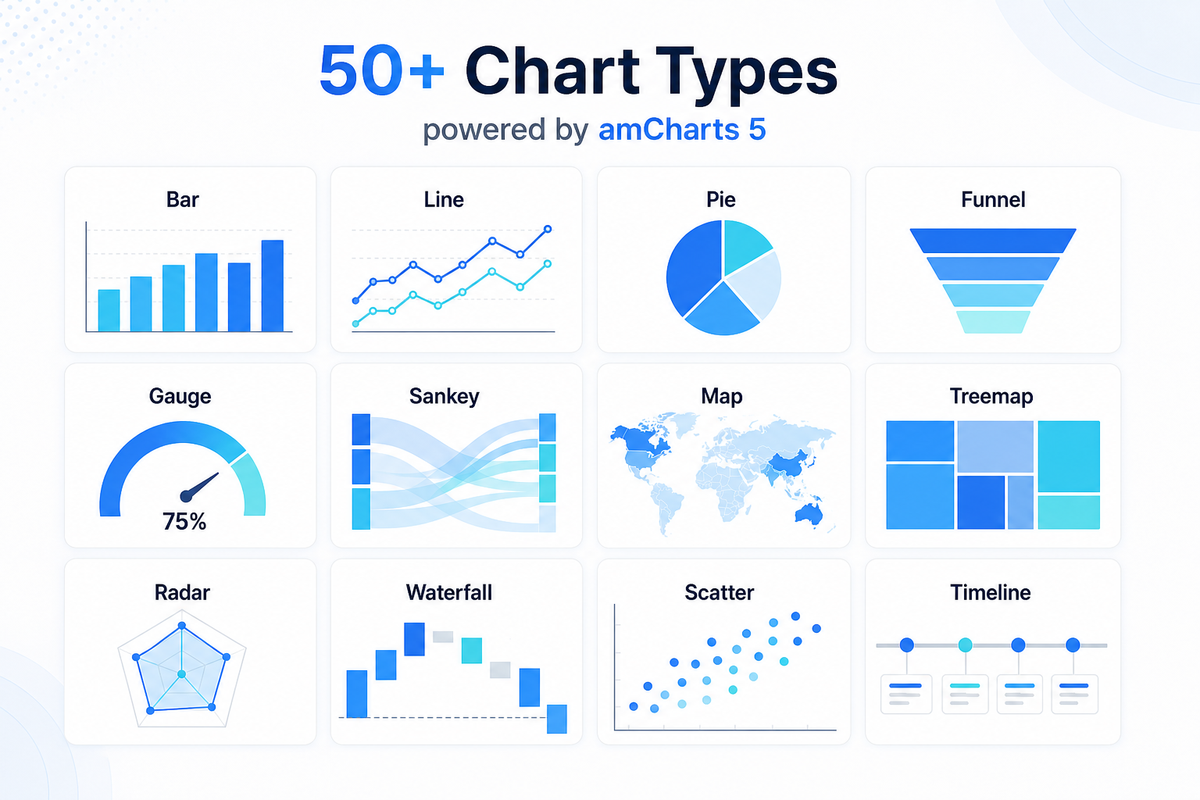
Full interactive dashboard canvas
Website viewers get the same modern GridStack canvas used in the backend — charts, tiles, KPIs, lists, and more.
- 50+ visualization types from Dynamic Dashboard
- Responsive grid layout with live chart rendering
- Dashboard switcher, date filters, and compare mode
- Custom filter widgets (selection / many2one)
- AI insights endpoint for published items
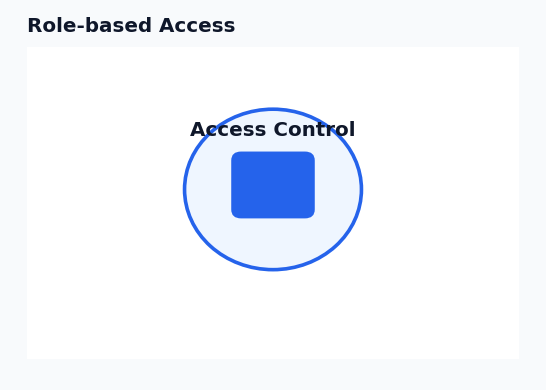
Group-based website access control
Keep sensitive boards private even when the website is public.
- Restrict dashboards with group_ids
- Restrict items with allowed_group_ids
- Works for public, portal, and internal users
- Record rules for published website visibility
- Managers retain edit capabilities when allowed
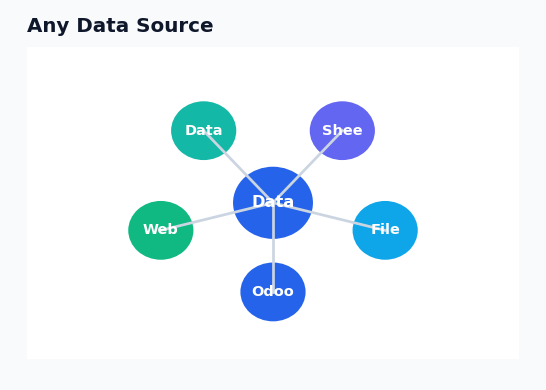
All Data or User Logged-In Data
Choose how portal and public visitors see records for published boards.
- All Data — show the full published dataset (company-scoped)
- User Logged In Data — respect the visitor’s record rights
- Safe SQL / model / external source handling
- Chart Options preferences saved per website viewer
- No need to open the backend to explore insights
Enable and disable chart options live
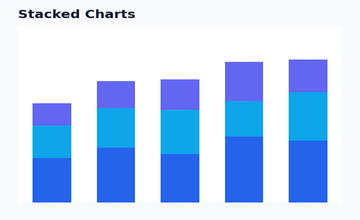
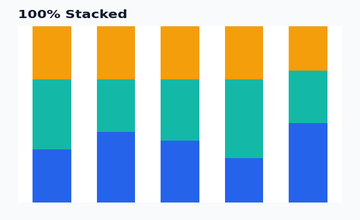
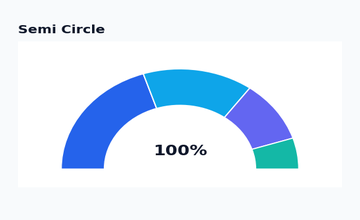
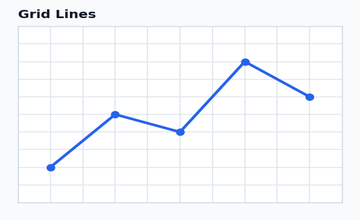
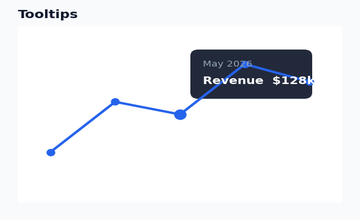
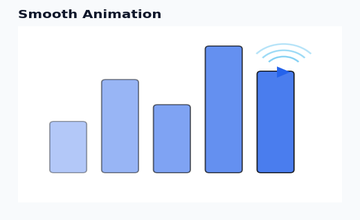
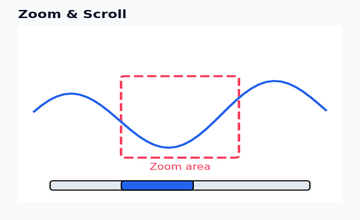
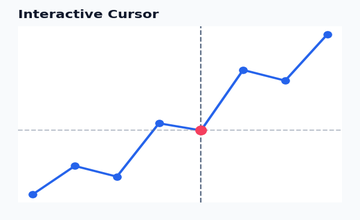
Website viewers can tune visuals from the More menu — legend, tooltips, animation, zoom, stacked, themes, and more.
- Legend on/off + position (top / bottom / left / right)
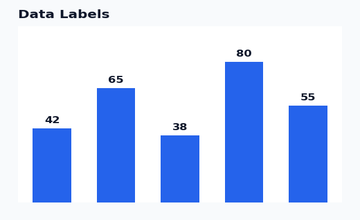
- Data labels, tooltip, animation, grid, cursor
- Stacked / 100% stacked / semi-circle
- Zoom and zoom bar controls
- Per-user preferences persist for non-managers
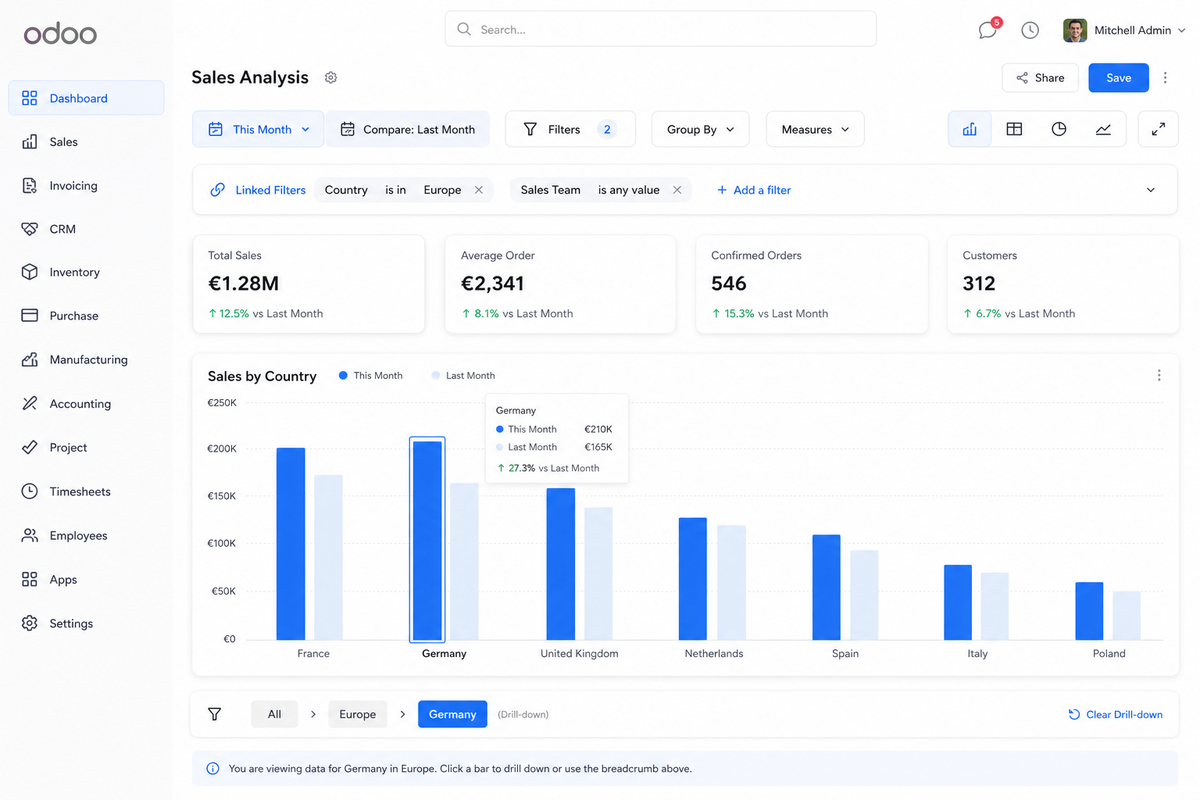
Website filters & date controls
Give website audiences the same analytical power as backend users.
- Global date filter with custom date ranges
- Dashboard custom filters with widget options
- Compare previous period
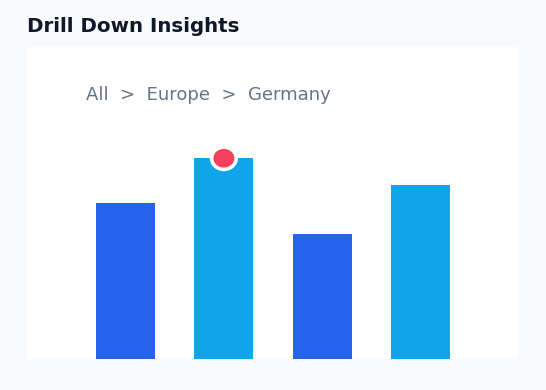
- Drill-down friendly chart interactions
- List / records modal for deeper inspection
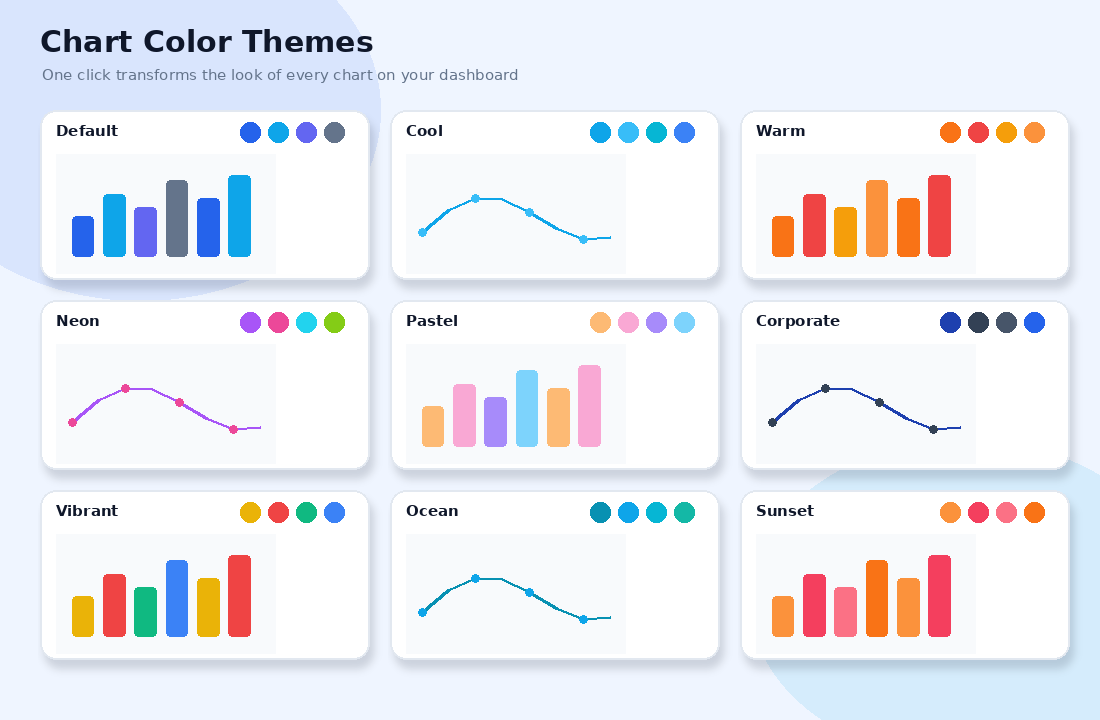
Dashboard & chart themes on the web
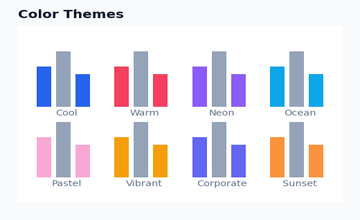
Match your brand with website-safe theme switching from the toolbar.
- Global chart theme selector on the website toolbar
- Item-level theme overrides where permitted
- Cool, warm, neon, pastel, corporate, ocean, sunset, and more
- Consistent palette across tiles, KPIs, and charts
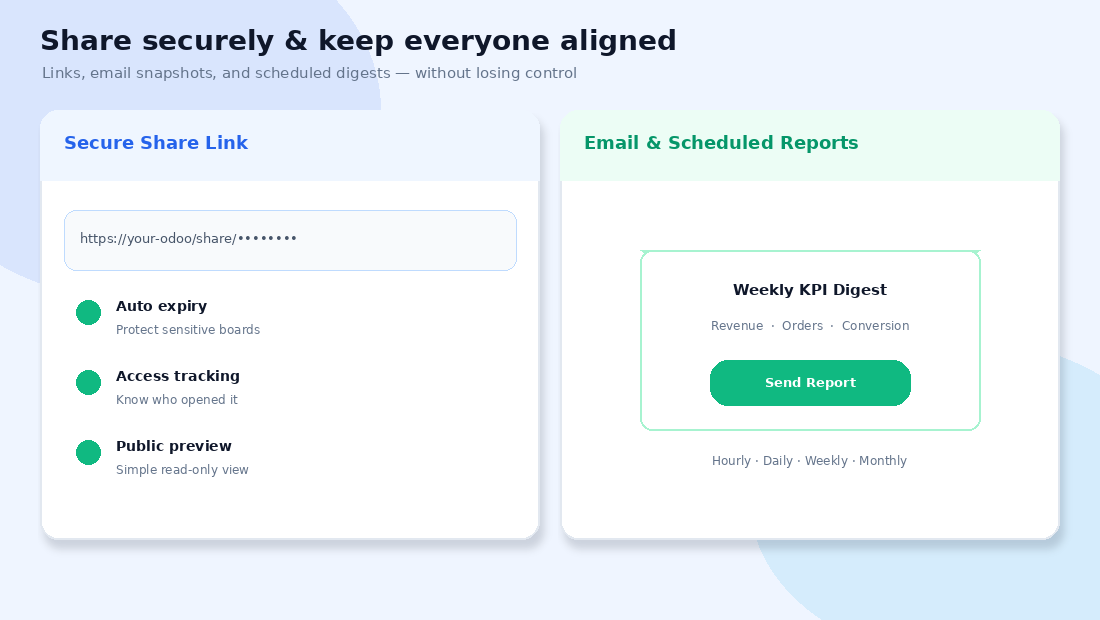
Secure share links and exports
Managers can share published boards and export insights directly from the website.
- Time-limited share tokens (
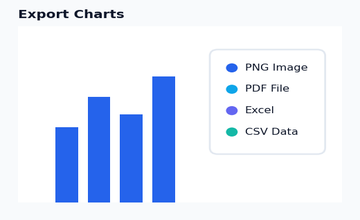
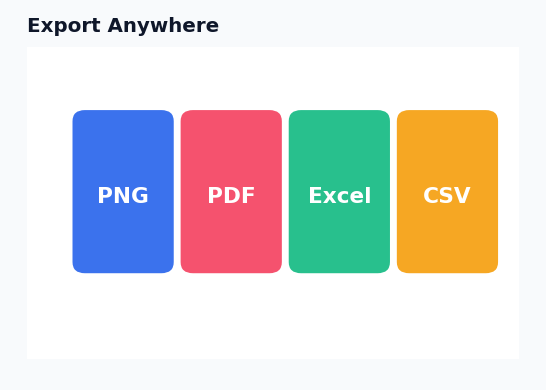
/dashboard/shared/) - Export PNG / PDF / Excel / CSV where available
- On-demand website report send
- Bookmark published boards
- Duplicate boards for rapid reuse
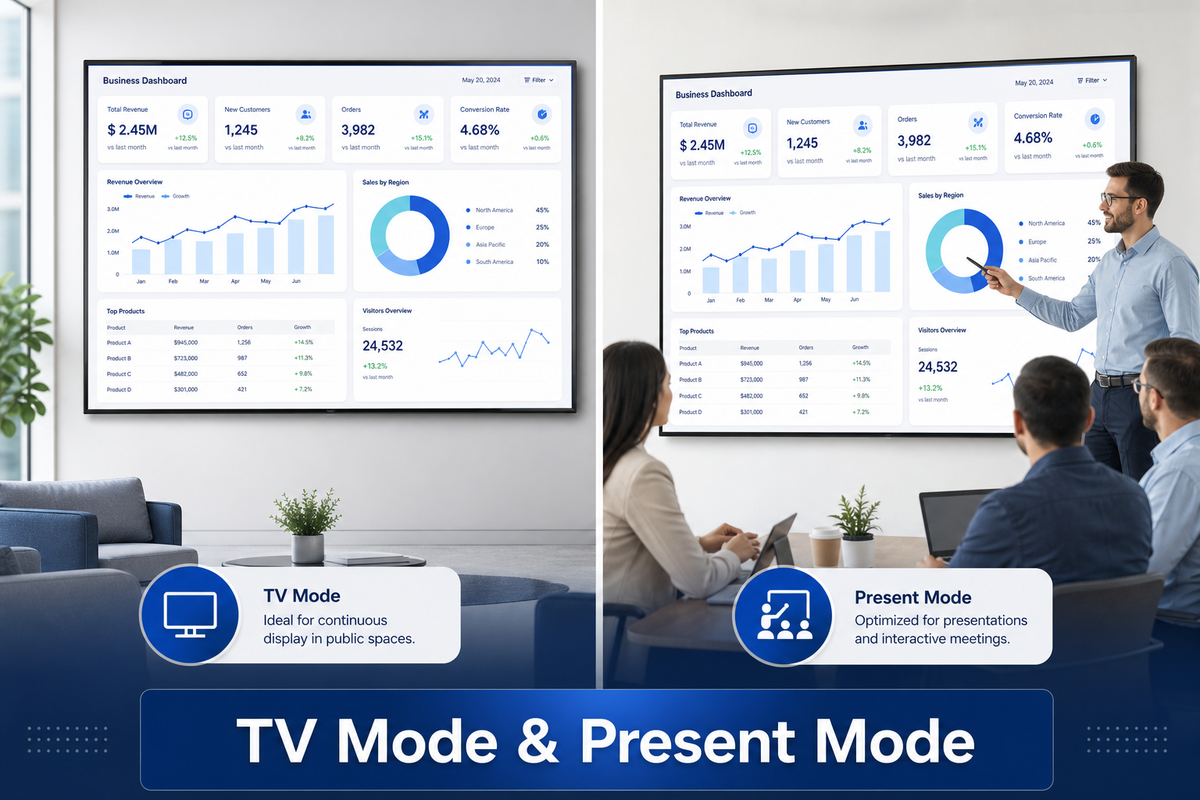
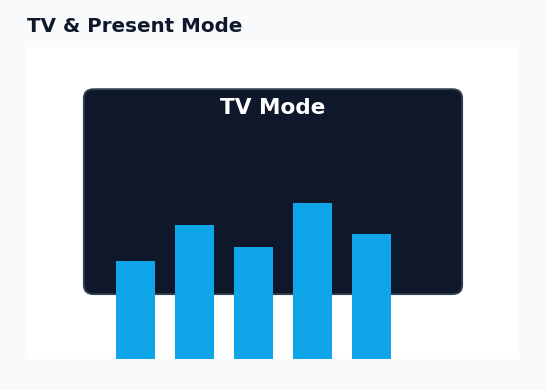
TV Mode & Present Mode on website
Run lobby screens, war rooms, and executive presentations from a published URL.
- TV Mode with interval rotation / focus
- Optional chrome hiding for clean displays
- Present Mode for guided walkthroughs
- Works on published website dashboards
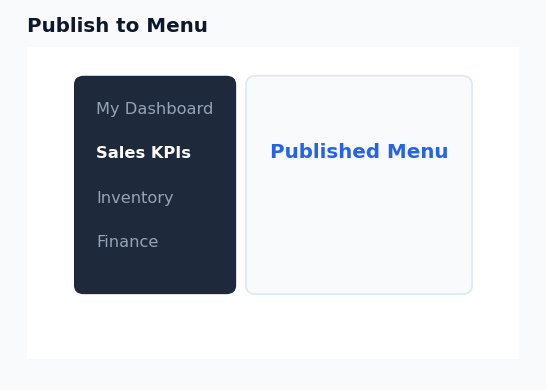
Add boards to the Website Menu
Promote key dashboards into your site’s main menu in one click.
- Action button: Add to Website Menu
- Creates a menu entry under the current website
- Uses the published dashboard URL automatically
- Ideal for customer portals and internal intranet sites
Responsive website UX extras
Polished frontend details that make long boards easy to use.
- Back-to-top control after scrolling
- RTL-aware dashboard chrome
- Loading states and clean empty gallery
- Desktop and mobile friendly layout
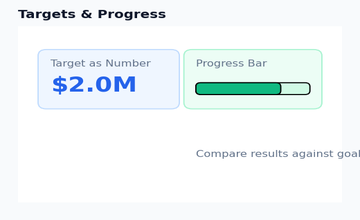
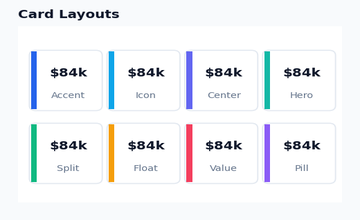
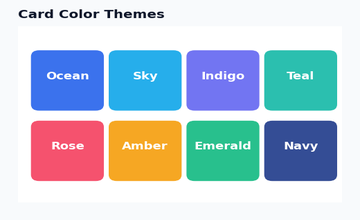
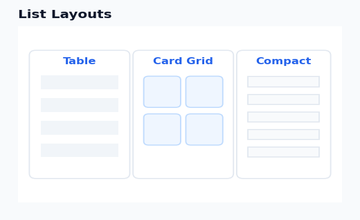
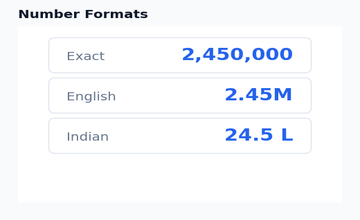
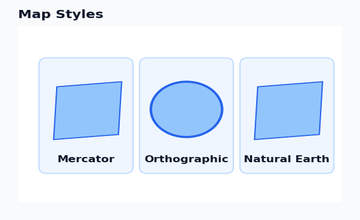
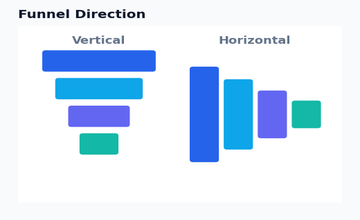
Chart Options available on the website
Fine-tune every visual from the chart More menu — themes, labels, stacking, zoom, targets, layouts, and more.
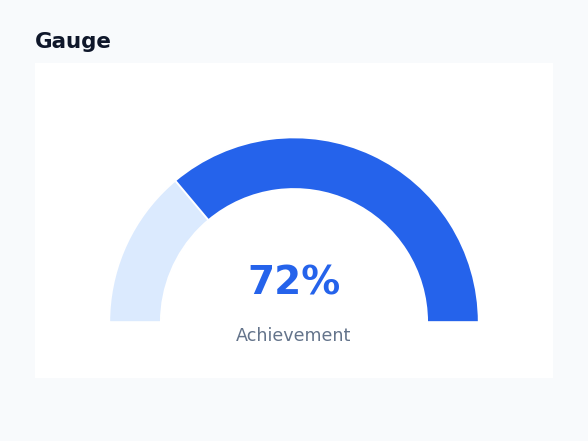
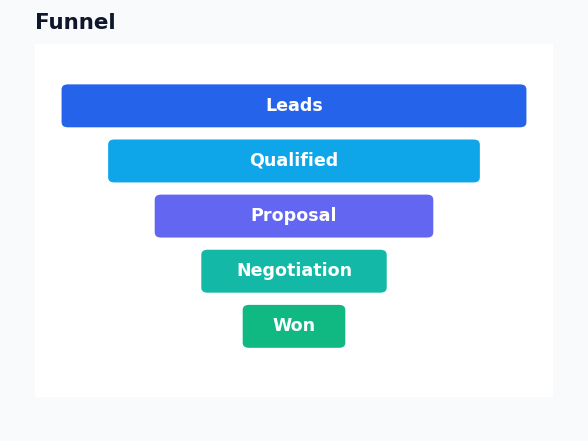
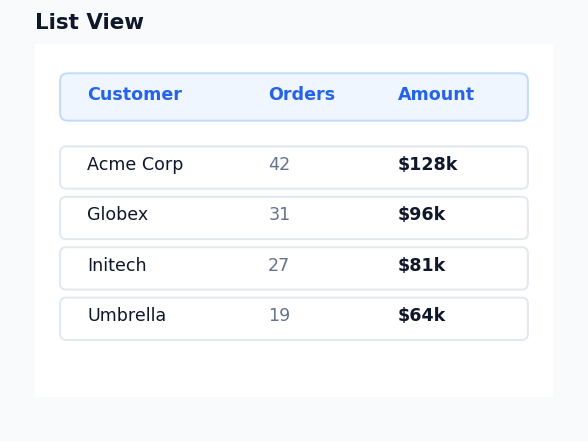
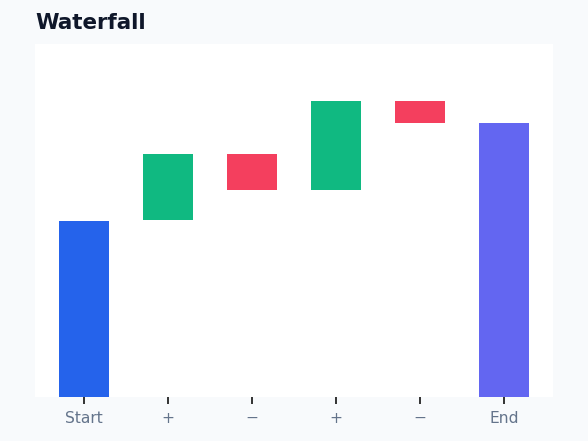
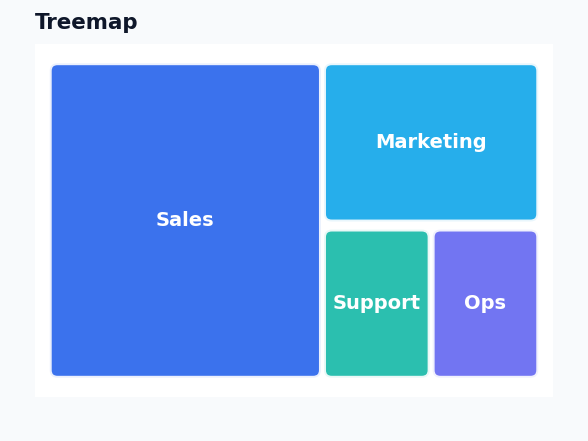
Visualizations that shine on the website
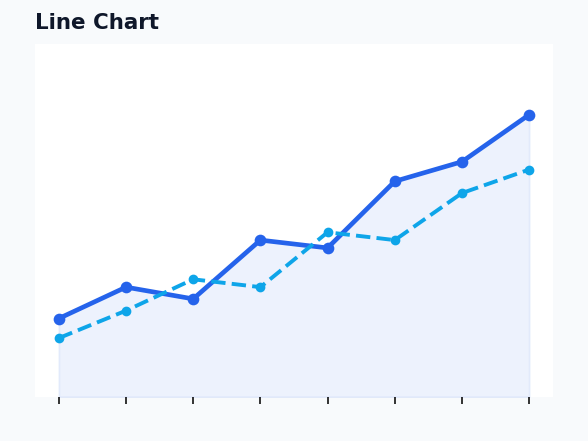
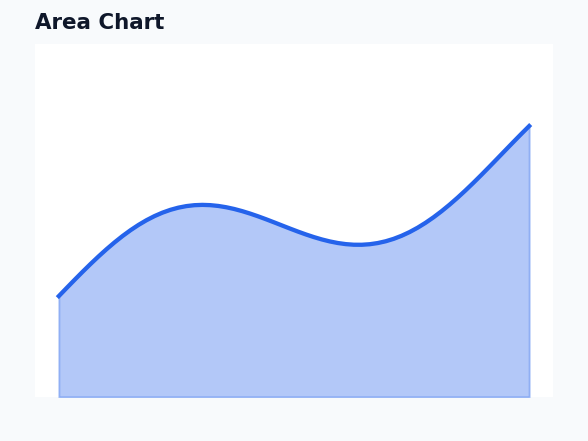
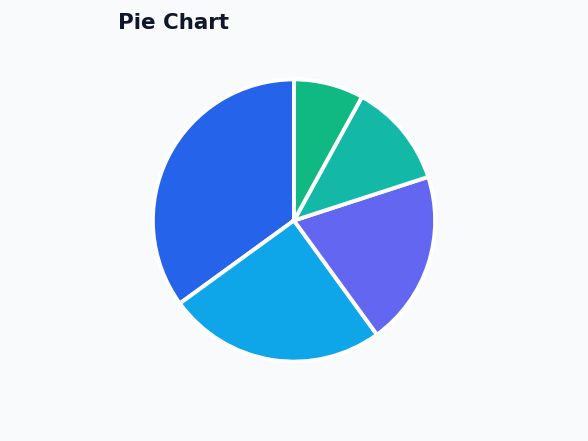
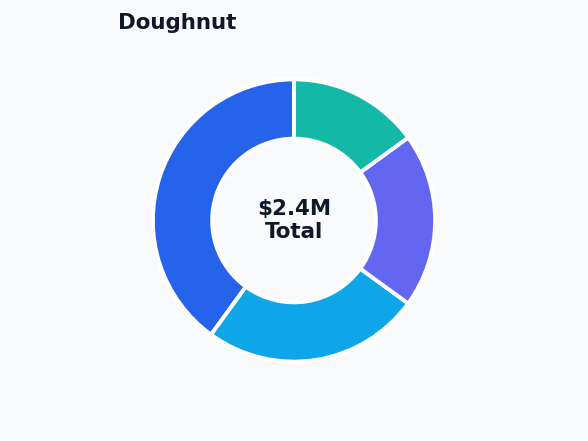
All dashboard item types can be published. Here are popular website-ready visuals.
More capabilities included
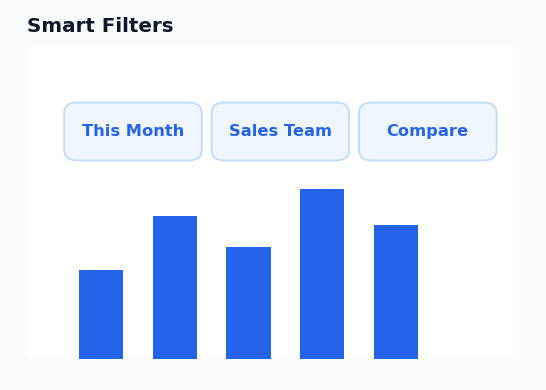
Website publishing inherits the power of dashboard and adds frontend-specific controls.
Complete feature checklist
A clear inventory of what this app adds and what it unlocks from the base app.
Website Publishing
- Show in Website on dashboards
- Show in Website on items
- Website Configuration page
- Website redirect button
- Add to Website Menu
- /dashboards hub gallery
- /dashboard/
canvas - Shared token URLs
- Back-to-top navigation
Access & Data
- Public website visitors
- Portal users
- Internal website users
- Dashboard group restrictions
- Item allowed groups
- All Data mode
- User Logged-In Data mode
- Company-safe publication
- Per-user Chart Option prefs
Interactivity
- Date filters & custom ranges
- Custom dashboard filters
- Compare previous period
- Chart Options toggles
- Theme switching
- Drill-down / records modal
- AI insight endpoint
- TV Mode / Present Mode
- Export / share / report / bookmark
Frequently asked questions
Click a question to expand the answer. Still unsure? Email us before you buy.
What is Website Dashboard AI?
Website Dashboard AI is an Odoo Website extension that publishes boards from Dynamic Dashboard AI (dynamic_dashboard_ai_nexgen) to public pages, portal accounts, and internal website sessions — with charts, KPIs, filters, Chart Options, TV Mode, share links, and optional AI insights.
Do I need dashboard installed first?
Yes. This module requires Dynamic Dashboard AI (dynamic_dashboard_ai_nexgen). Install Dynamic Dashboard AI (dynamic_dashboard_ai_nexgen) first, then install this website extension. Website and Portal apps are also required.
Where can I get the required parent app?
Install the Dynamic Dashboard AI module (dynamic_dashboard_ai_nexgen).
Is this app compatible with Odoo Community and Enterprise?
Yes. It works on Odoo Community, Enterprise (on-premise), and Odoo.sh for Odoo 19. Odoo Online (SaaS) does not allow third-party apps.
Which Odoo version is supported?
This listing is built and tested for Odoo 20. Contact us if you need guidance for another major version.
Does this app require an external AI service?
Only for optional AI features inherited from the parent module. You bring your own API key for OpenAI, Google Gemini, Anthropic Claude, Cursor, or a compatible endpoint. Core website dashboards (publish, charts, filters, KPIs, TV Mode, sharing) work without any external AI service.
Are AI features included in the purchase price?
Website publishing is included. Optional AI insights on published items come from the parent module. You connect your own AI provider key in Settings, so billing and privacy stay under your control.
How do I publish a dashboard to the website?
Open a dashboard in dashboard, enable Show in Website, configure Website Record Data and groups if needed, then open /dashboards or /dashboard/. Optionally use Add to Website Menu.
Can public visitors see my dashboards?
Yes, if the dashboard is published and not restricted by groups. You can also limit visibility to portal or internal groups only.
What is the difference between public, portal, and internal website access?
Public visitors can open boards without login (when allowed). Portal users authenticate as customers/partners. Internal users open boards from the website frontend with their employee/login rights.
What is Website Record Data?
All Data shows the published dataset to portal/public users (within company boundaries). User Logged In Data keeps each visitor inside their own record rights.
Can I hide some widgets from the website but keep them in the backend?
Yes. Use per-item Show in Website so sensitive widgets stay backend-only while the rest of the board is published.
Can website users change Chart Options like Legend?
Yes. Viewers can toggle Legend, Tooltip, Animation, Zoom, themes, and more from the chart More menu. Managers can write options to the item; other users save personal preferences.
Which Chart Options are available on the website?
Legend position, data labels, tooltip, animation, grid, cursor, stacked / 100% stacked, semi-circle, zoom, themes, targets, card layouts, list layouts, number formats, map styles, funnel direction, and exports — depending on the widget type.
Does TV Mode work on the website?
Yes. Open a published dashboard URL and start TV Mode or Present Mode from the website toolbar — ideal for lobbies, war rooms, and executive screens.
Can I put a dashboard in the website main menu?
Yes. Use Add to Website Menu on a published dashboard form. A menu entry is created automatically under the current website.
What URLs are used for website dashboards?
The hub gallery is /dashboards. Individual boards use /dashboard/. Shared links use /dashboard/shared/.
Are SQL / API / Excel widgets supported on the website?
Yes. Published items from all dashboard calculation types (Odoo models, Custom SQL, Visual Query Builder, Excel/CSV, Google Sheets, APIs, databases) can render on the website, subject to Website Record Data mode and access rules.
Can I publish Sales, CRM, Inventory, or Accounting dashboards?
Yes. Any board created in dashboard — including Sales, CRM, Inventory, Accounting, HR, and Project boards — can be published to the website.
How many chart and widget types can appear on the website?
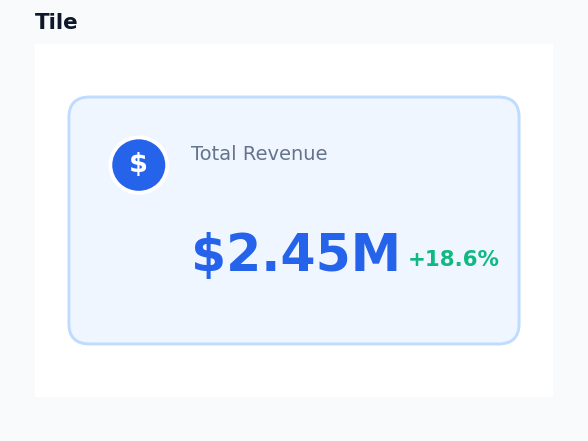
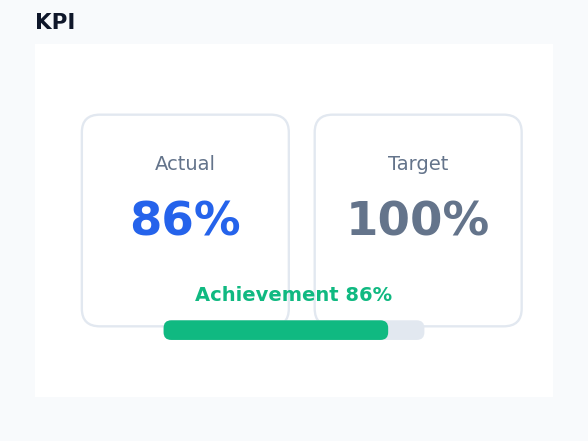
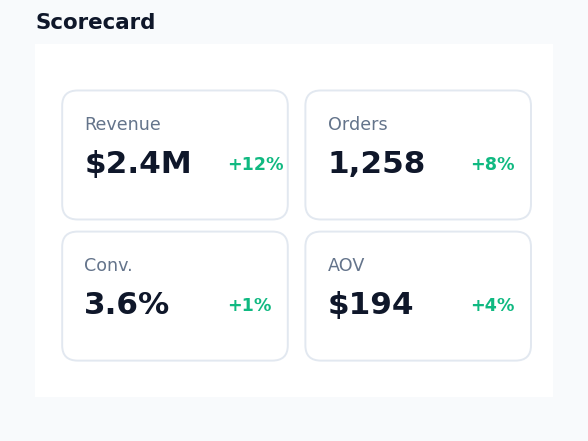
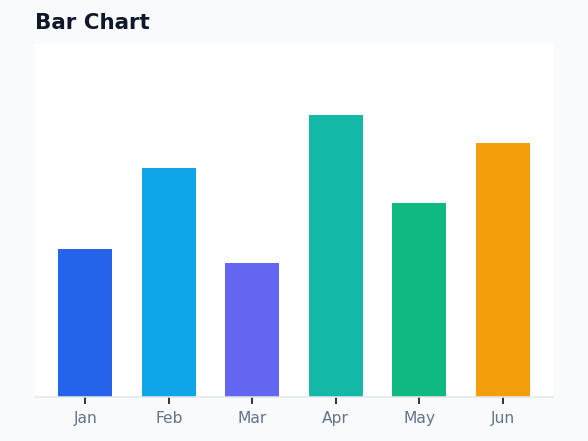
Website publishing supports the full dashboard visual set (50+ types): tiles, KPIs, scorecards, bars, lines, areas, pies, gauges, funnels, maps, lists, waterfalls, treemaps, and more.
Can users filter by date on the website?
Yes. Website viewers can use global date filters, custom ranges, compare previous period, and dashboard custom filters (selection / many2one widgets).
Can users drill down into chart details from the website?
Yes. Charts support drill-down friendly interactions and a list / records modal so visitors can inspect underlying data through website-safe endpoints.
Can I share a website dashboard with people outside Odoo?
Yes. Managers can create time-limited share tokens for published boards so partners can open a secure URL without a full Odoo backend login.
What export formats are available on the website?
Where available, managers can export PNG, PDF, Excel, or CSV from the website, and send on-demand website reports.
Can authenticated users bookmark published boards?
Yes. Authenticated website users can bookmark favorite published boards for faster return visits.
How do group-based access rights work on the website?
Restrict whole dashboards with group_ids and individual widgets with allowed_group_ids. Record rules keep published visibility company-safe for public, portal, and internal users.
Is it multi-company ready on the website?
Yes. Published boards respect company boundaries so each entity keeps its own secure analytics space.
Does it support multiple currencies and number formats on the website?
Yes. Website boards inherit dashboard number systems (Exact, English K/M/B, Indian Lakh/Crore, and custom formats) and currency display options.
Is right-to-left (RTL) supported on the website?
Yes. Website dashboard chrome is RTL-aware and follows the visitor language direction when configured.
Will publishing dashboards slow down my website?
The module is designed for interactive website analytics with refresh controls and the same performance patterns as the parent dashboard app. Use sensible refresh intervals for TV Mode and heavy queries.
Do website themes match my brand?
Yes. Visitors can use the website toolbar theme selector, and item-level theme overrides remain available where permitted (cool, warm, neon, pastel, corporate, ocean, sunset, and more).
Can I use AI insights on published website items?
Yes, when AI is configured in the parent module. Website published items can call the AI insights endpoint. Boards still work fully if AI is disabled.
Are sample / demo dashboards available for the website?
Yes. Demo boards from dashboard can be published for quick evaluation when demo data is installed.
How do updates work?
Purchase is per Odoo major version listing (for example Odoo 19). Check this Apps Store page for the latest build, and keep the parent module updated as well.
Do I get free support after purchase?
Yes. You get 90 days free support from purchase for installation help, configuration guidance, questions, and bug fixing (excluding data recovery).
Is there a demo before buying?
Yes. Email nexgensolutionsodoo@gmail.com to request a personalized walkthrough of website publishing, portal access, Chart Options, and TV Mode.
What is the license type?
The app is sold on the Odoo Apps Store under the Odoo Proprietary License v1.0 (OPL-1) by NexGen Solutions. After purchase, you may use it on your Odoo databases according to the store terms.
Can you customize website dashboards for our industry?
Absolutely. We can help with portal boards, customer/partner dashboards, branding, and implementation. Email nexgensolutionsodoo@gmail.com with your requirements.
Who should I contact for pre-sale or support questions?
Contact NexGen Solutions at nexgensolutionsodoo@gmail.com. We are happy to help before and after purchase.
Explore our premium solutions
Elevate your Odoo workspace with our meticulously crafted modules.



Ready to publish live dashboards on your website?
Install Dynamic Dashboard AI, add Website Dashboard AI, publish a board, and share the URL.
Website Dashboard AI · License OPL-1
Author & Maintainer: NexGen Solutions · nexgensolutionsodoo@gmail.com